Five Step Process Chart for Business Data: A Practical Framework for Clear Communication
Every professional eventually faces the same challenge: how do you present complex business data in a way that people actually understand and act on? Raw numbers, scattered insights, and dense reports often fail to drive decisions. The Five Step Process Chart offers a structured remedy. It is not just a visual aid; it is a practical framework for breaking down information into digestible, sequential stages that respect how people process data.
This approach combines elements of workflow design, diagram logic, and visual clarity. Whether you work in marketing, management, banking, or run your own small business, this method helps you transform scattered information into a coherent narrative. Below, we explore what this tool is, where it fits in real workflows, and how you can integrate it into your daily operations without unnecessary complexity.
What the Five Step Process Chart Brings to Business Data
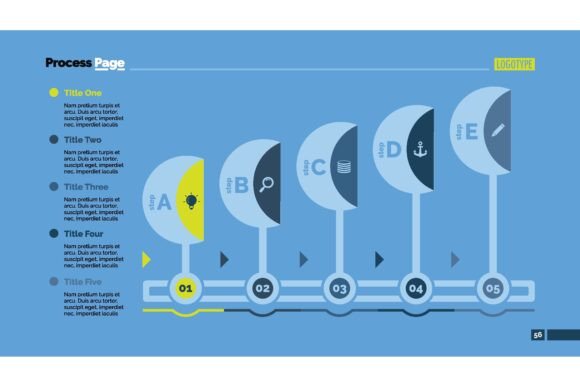
At its core, the Five Step Process Chart is a sequencing tool. It takes a dataset, a project timeline, or a strategic plan and distills it into five logical stages. Each stage builds on the previous one, creating a flow that mirrors how teams actually work: step by step, with clear handoffs and measurable outcomes.
This is especially valuable for business data because data alone can be overwhelming. A chart that organizes data into five steps forces you to prioritize what matters most. Instead of dumping every metric onto a slide, you select the key indicators at each phase. The result is a presentation that feels like a story rather than a spreadsheet dump.
The chart excels in environments where clarity is critical. For example, in banking compliance reports, a five-step flow can illustrate how data moves from collection to validation to reporting. In marketing, it can show the customer journey from awareness to conversion. The structure adapts to the domain, not the other way around.
Before the Project: Planning with the Five Step Chart
One of the most underutilized uses of the Five Step Process Chart happens before any work begins. When you are scoping a new initiative, the chart serves as a planning skeleton. You map out the five critical phases your data will pass through, and you identify what information you need at each stage.
Consider a product launch. Before you start building anything, you sketch out five steps: market research data, product specifications, pricing analysis, launch timeline metrics, and post-launch feedback. This pre-work ensures your data collection efforts are aligned with your presentation goals. You are not gathering data for the sake of it; you are gathering data that fits into a known structure.
This planning phase also helps with resource allocation. When you know you need five distinct data clusters, you can assign team members to each one, set deadlines, and establish quality checks. The chart becomes a shared reference point that keeps everyone aligned on what data matters and when.
For entrepreneurs and small business owners, this pre-project use is especially powerful. You may not have a dedicated data team, but you can still plan your quarterly review around five clear steps. It reduces the cognitive load of trying to remember everything at once.
During Execution: Using the Chart as a Live Dashboard
Once a project is underway, the Five Step Process Chart transforms into a tracking tool. You update each step with real-time data, replacing static planning with dynamic monitoring. This works particularly well for agile teams and freelancers who need to communicate progress to clients without lengthy status meetings.
Imagine you are managing a marketing campaign. Step one might show audience segmentation data, step two shows content engagement metrics, step three shows conversion rates, step four shows ROI calculations, and step five shows retention figures. As each step updates, the chart tells a story of cause and effect. If engagement drops, you can trace back to the segmentation data to find the root cause.
This live usage also integrates well with existing tools. You can pull data from Google Analytics, CRM platforms, or project management software and plug it into your five-step structure. The chart does not replace these tools; it contextualizes them. It shows the relationship between data points that otherwise live in separate systems.
For managers, this means less time hunting for information and more time interpreting it. The chart becomes a single source of truth for the project's data narrative. You can share it with stakeholders during weekly reviews without needing to explain a complex dashboard. Five steps are intuitive enough for anyone to follow.
After Completion: Archiving Insights and Building Institutional Knowledge
The Five Step Process Chart is equally valuable after a project ends. Instead of letting data scatter across emails and folders, you archive the completed chart as a reference document. This creates a repeatable pattern for future work.
For example, a financial analyst preparing quarterly reports can use the same five-step chart each period: data extraction, validation, analysis, visualization, and commentary. Over time, these charts form a library of institutional knowledge. New team members can review past charts to understand how data was processed and presented. This reduces onboarding time and maintains consistency across reports.
Publishers and educators can also benefit from this post-project use. If you create educational content or industry reports, the five-step chart gives readers a clear roadmap of your findings. It turns a dense PDF into a scannable visual that communicates the core message at a glance.
Moreover, archived charts serve as templates. When a similar project arises, you duplicate the chart structure and populate it with new data. This saves hours of design and planning time. You are not reinventing the presentation each time; you are refining a proven format.
How the Chart Interacts with Other Tools and People
No tool works in isolation, and the Five Step Process Chart is designed for integration. It complements spreadsheet software, presentation tools, and data visualization platforms. You can create the chart in PowerPoint, Google Slides, Canva, or even a whiteboard tool like Miro. The format is flexible, but the discipline of five steps remains constant.
For teams, the chart improves collaboration. Each step can be assigned to a different person, making responsibilities clear. In a management context, you might use the chart during board meetings to walk through strategic data points. Each step invites discussion and questions, turning a passive presentation into an interactive review.
The chart also works well with decision-making frameworks. If you use SWOT analysis, OKRs, or the Pyramid Principle, you can map those outputs into the five-step structure. This bridging capability makes the chart a universal adapter for business data. It does not force you to abandon your existing methods; it enhances them.
For freelancers and solo professionals, the chart acts as a communication bridge. When you present data to clients who are not data-savvy, the five steps provide a gentle learning curve. Clients trust what they can follow. The chart builds confidence in your analysis without requiring technical expertise on their part.
Practical Implementation Tips for Consistent Use
Getting the most out of the Five Step Process Chart requires some preparation and discipline. Here are actionable tips based on real usage patterns:
1. Define your five steps before you gather data. This prevents scope creep. When you know the five categories, you filter out irrelevant information early. For example, if your steps are awareness, consideration, conversion, retention, and advocacy, you ignore metrics that do not fit those stages.
2. Keep each step focused on one key insight. A common mistake is cramming too many data points into a single step. If a step becomes crowded, split it into sub-steps or reconsider your sequence. The goal is clarity, not completeness.
3. Use consistent naming conventions across projects. If you standardize step labels like Collect, Analyze, Visualize, Present, and Archive, your team will recognize the pattern immediately. This consistency speeds up comprehension and reduces errors.
4. Test your chart on a colleague before presenting. Ask them to explain the data back to you. If they can do it accurately, your chart works. If they get stuck, revise the sequence or simplify the data. This feedback loop is essential for quality control.
5. Archive every chart you create. Build a folder or a shared drive with dated versions. Over time, you will see patterns in your data that inform strategic decisions. These archives also serve as proof of work for audits or client reviews.
6. Update your chart in real time when possible. Static charts are useful, but live data makes the chart a decision-making tool. Use linked spreadsheets or auto-updating visuals to keep the chart current throughout the project lifecycle.
7. Teach the method to your team. The more people understand the five-step approach, the more naturally data flows through your organization. Consider a short training session on how to structure data into five stages. It pays dividends in efficiency.
Long-Term Benefits for Productivity and Consistency
Adopting the Five Step Process Chart is not a one-time fix. Over months and years, it becomes a habit that shapes how you approach data. You start thinking in sequences rather than in isolated numbers. This mental shift improves both the speed and quality of your analysis.
For small business owners, this habit translates into faster decision-making. When you have a consistent way to review sales data, customer feedback, or operational metrics, you spend less time deciphering and more time acting. The chart removes the friction of figuring out how to present data each time.
For educators and bloggers, the five-step structure makes your content more accessible. Readers appreciate a clear path through complex topics. When you present data in five understandable steps, your audience retains more and engages longer. This is especially valuable for how-to guides, case studies, and industry analyses.
For marketers and managers, the chart enhances reporting credibility. Executives and clients prefer concise, logical presentations over sprawling dashboards. A well-designed five-step chart signals that you have thought critically about what matters. It builds trust in your expertise.
Finally, the chart supports long-term quality control. Because each step is defined, you can audit your data at every stage. If a metric seems off, you know exactly where to look. This traceability reduces errors and improves the integrity of your business data over time.
The Five Step Process Chart is a practical, adaptable tool that fits naturally into planning, execution, and review. It respects how people think, how teams work, and how data tells a story. Whether you are a solopreneur, a department head, or a creative professional, this framework can elevate how you present and act on business data. Start with five steps, stay consistent, and let the structure do the heavy lifting for you.