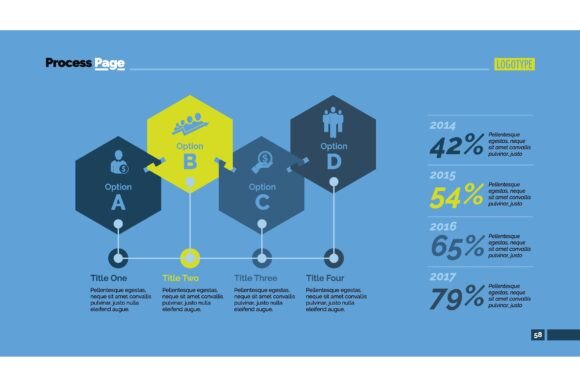
Four Linked Hexagons Percentage Chart
Data visualization is rarely about simply showing numbers. It is about telling a story, guiding the eye, and making connections visible. Standard bar charts and pie graphs serve their purpose, but they often fail to capture relationships between multiple metrics at once. That is where the Four Linked Hexagons Percentage Chart steps in. This design uses four interconnected hexagons, each representing a percentage value, linked in a way that reveals proportion, flow, or progression at a glance. Instead of isolating data points, it forces them into dialogue. For anyone building infographics, dashboards, or presentation slides, this layout offers a fresh, visual shorthand for complex comparisons.
What Makes the Linked Hexagon Layout Different
At its core, this chart trades isolated bars or slices for a network of shapes that physically connect. Each hexagon holds a percentage, but because the hexagons are linked, the viewer immediately sees how one value relates to the next. The geometry itself suggests continuity. There is no need to trace lines across a grid or interpret a legend. The eye moves naturally from one cell to the next, following the chain. This design is especially effective when you want to show a sequence, a funnel, or a set of interdependent metrics. Whether you are visualizing stages of a sales process, distribution of resources, or progress across quarters, the linked structure reinforces the message that each piece belongs to a larger whole.
The percentage focus further sharpens the story. Percentages strip away raw numbers and frame everything in relative terms. This makes the chart ideal for comparison across different scales. A small department and a large division can sit side by side, their contributions measured in the same language. The hexagon shape itself is visually bold. Its six sides create a natural grid and allow for clean labeling without clutter. When you combine four of them in a linked chain, you get a compact, balanced composition that works well in both horizontal and vertical layouts.
Creative Applications Across Different Roles
The versatility of this chart means it can be adapted by professionals with very different goals. For a marketing manager, the four hexagons might represent stages of a campaign funnel: awareness, consideration, conversion, and retention. Each hexagon shows the percentage of users who move to the next stage, creating an instant visual of where drop-offs occur. The linked design reinforces the idea that each stage feeds into the next, which is exactly the logic of a funnel. You can add arrows or gradient fills to emphasize flow, or keep the hexagons clean with simple percentage labels.
A designer working on an annual report could use the same layout to compare four product lines by market share. Instead of a static bar chart, the linked hexagons create a more engaging spread. The percentages sit inside each shape, and you can use color to signal performance—warm tones for growth, cool tones for decline. The hexagons can be arranged in a row, a square, or even a staggered pattern depending on the available space. The adaptability of the layout makes it easy to integrate into existing brand templates without breaking the visual language.
For educators and trainers, the chart becomes a teaching tool. Imagine breaking down a company’s resource allocation into four categories: salaries, operations, R&D, and marketing. Each hexagon shows the percentage of total budget. Students can see not just the numbers, but how the categories relate. The linked design invites discussion about trade-offs and interdependencies. Why does one hexagon dominate? What happens if you shift a few percentage points from one category to another? The visual makes these abstract questions concrete.
Adapting the Chart for Different Audiences
One of the strongest features of the Four Linked Hexagons Percentage Chart is how naturally it scales for different levels of data literacy. When presenting to executives who need quick insights, keep the design minimal. Use hexagons in a single row, fill them with distinct colors, and place the percentage prominently in the center. Avoid extra labels or annotations. The simplicity of the hexagon chain makes the comparison obvious within seconds.
For a more data-savvy audience, such as analysts or project leads, you can layer in additional information. Add a small subtitle below each percentage to indicate the metric name. Use hexagon size variation to encode a secondary variable, like total volume or growth rate, while keeping the percentage as the primary label. You can also connect the hexagons with lines or shaded links to emphasize the relationship between adjacent cells. Just be careful not to overload the visual. The strength of this chart is its clarity. Every extra element should serve the story, not distract from it.
When the audience is external, such as clients or the general public, focus on aesthetics and narrative. Use brand colors, clean typography, and a layout that fits the platform. For social media infographics, a vertical stack of linked hexagons works well on mobile screens. For printed reports, a horizontal arrangement allows room for supporting commentary beside each hexagon. The key is to match the visual density to the audience’s expectations and the medium’s constraints.
Practical Guidance for Building Your Own Version
Creating this chart is more straightforward than it might seem. You can build it in presentation software like PowerPoint or Keynote by using polygon shapes and aligning them manually. Most tools allow you to rotate and resize hexagons, then link them with connectors or simply by arranging them edge to edge. For more precision, vector editing tools like Illustrator or Figma give you full control over alignment, spacing, and color. If you work with data visualization platforms like Tableau or Power BI, you can create custom polygon shapes and map your percentage data to fill colors or labels. There are also templates available for infographic tools like Canva that already include linked hexagon layouts.
Start by deciding what your four values represent. They should be part of a coherent set—four stages of a process, four segments of a whole, or four time periods. Avoid mixing unrelated metrics in the same chain. The linked design works best when there is a logical connection between the cells. Once you have your four percentages, arrange the hexagons in the order that tells the clearest story. Sequence matters. If the values increase or decrease, place them in that order. If they represent categories without a natural sequence, arrange them by size or alphabetical order for consistency.
Color choice is critical. Use a single hue with varying saturation to show intensity, or use four related colors that signal a theme. For example, cool blues for technology metrics, warm oranges for growth indicators, or a gradient from green to red for performance scores. Keep the background light and the text dark for readability. If you are working with a brand palette, test the contrast inside the hexagons. White text on a light fill can be hard to read, so adjust the fill opacity or use a darker shade.
Real-World Examples That Demonstrate Impact
Consider a SaaS company presenting its quarterly product adoption rates. The four hexagons show the percentage of users who have completed onboarding, used a core feature, upgraded to premium, and referred another user. The linked layout makes it clear that these are not isolated stats. Each percentage depends on the previous step. A low percentage in the second hexagon immediately signals a bottleneck. The chart becomes a diagnostic tool, not just a reporting graphic.
In a training context, a leadership workshop might use the hexagons to represent employee satisfaction across four departments. Each hexagon shows the percentage of positive survey responses. The linked arrangement invites comparison across departments while reinforcing that they are part of the same organization. A facilitator can point to the hexagon with the highest percentage and ask what that team is doing differently, then contrast it with the lowest. The visual structure supports both analysis and discussion.
For a freelance designer pitching a rebranding proposal, the chart can demonstrate market perception across four dimensions: awareness, trust, modernity, and loyalty. Each hexagon shows the current percentage based on survey data. The client sees immediately where the brand is strong and where it needs work. The linked hexagons suggest that these dimensions are interconnected—improving trust could lift loyalty, for example. The chart becomes a persuasive tool that turns raw survey data into a compelling visual argument.
Keeping Your Data Presentation Clear and Effective
The biggest risk with any custom chart is overcomplication. The Four Linked Hexagons Percentage Chart is visually engaging, but that same boldness can work against you if you add too many elements. Stick to one primary data set per chart. If you have multiple groups of four metrics, create separate charts rather than cramming everything into one. Use labels sparingly. A percentage inside the hexagon and a short name below or beside it is usually enough. If you need to add footnotes or source lines, place them outside the hexagon area so they do not distract from the visual.
Consistency matters across a presentation or report. If you use linked hexagons for one data set, consider using the same layout for related charts to create a visual rhythm. The audience will quickly learn the format and focus on the data itself. You can vary the colors to indicate different themes or time periods, but keep the arrangement and size consistent. This builds familiarity and trust.
Finally, test the chart with someone who has not seen the data before. Ask them what story they see in the four hexagons. If their interpretation matches your intended message, the design is working. If they get confused, simplify. The goal is not to impress with complexity but to communicate with clarity. A well-designed chart disappears into the background and lets the numbers speak.