Corporate Business Infographics Bundle: Transform Your Data into Clear, Compelling Visuals
A deck of slides filled with dense text, cluttered charts, and inconsistent visuals can undo even the strongest business case. You have seen it happen. A stakeholder zones out. A client looks confused. The message gets lost. This is the problem that the Corporate Business Infographics Bundle directly solves—yet many people still misuse such tools, leaving their presentations flat or worse, confusing.
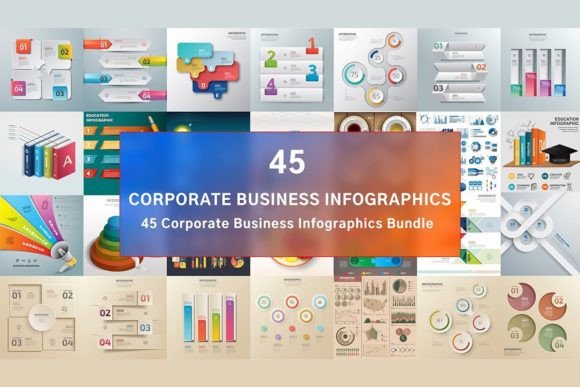
The Corporate Business Infographics Bundle is a collection of 45 professionally designed templates built for corporate and business presentations. Each template gives you a structured framework to present financial data, marketing statistics, project timelines, strategic roadmaps, and other complex information in a way that is visually clean and easy to follow. The bundle includes customizable icons, color palettes, charts, and graphics so you can adapt each slide to your brand and message. It is a practical resource for anyone who needs to communicate data clearly—whether you are an entrepreneur pitching to investors, a marketer reporting quarterly results, or a team lead mapping out a process.
But owning a powerful tool is not the same as using it well. Many people download a bundle like this and still end up with presentations that miss the mark. The problem is rarely the templates themselves. It is how people choose, customize, and apply them. If you want to avoid the most common pitfalls, it helps to know what they are before you open the file.
Mistake One: Treating the Template as a Final Product
The biggest misunderstanding about pre-built infographic templates is thinking they are ready to use straight out of the box. They are not. A template is a starting point, not a finished slide. The Corporate Business Infographics Bundle gives you professionally designed layouts, but the data, context, and narrative must come from you.
When you drop raw data into a beautiful chart without considering what story that data tells, the result looks polished but feels hollow. Viewers walk away remembering the nice colors but not the insight you wanted them to take home.
The better approach: Before you start editing any slide, ask yourself what you want your audience to understand or do after seeing it. Then look through the 45 templates and pick the one that best supports that goal. Only then should you begin adding your content. Treat the template as a scaffold for your message, not a substitute for it.
Mistake Two: Overloading a Single Infographic with Everything You Know
Infographics are meant to simplify, not to contain every data point you have. One of the most common errors I see is people trying to cram an entire quarter's performance into a single slide. They add five different chart types, three callout boxes, and a timeline all in one layout. The result is visual noise. Your audience does not know where to look first, and the key message gets buried.
The templates in this bundle are designed with whitespace and visual hierarchy for a reason. Each layout has a primary focal point—a main chart, a central number, or a key comparison. When you overload that layout, you defeat the purpose of using a professionally designed infographic in the first place.
The better approach: Use one template per key idea. If you have three important metrics that each tell a different story, use three separate slides. The Corporate Business Infographics Bundle gives you 45 templates, so you have plenty of room to spread your content out. Let each slide breathe. Your audience will thank you.
Mistake Three: Ignoring Visual Hierarchy and Flow
A good infographic guides the eye naturally from the most important information to supporting details. Many presenters overlook this principle because they focus on making everything look good rather than making it easy to read. They use large fonts for secondary data points, place critical numbers in corners, or apply bright colors to less important elements.
The templates in the Corporate Business Infographics Bundle already have hierarchy built in. The title area is prominent. The primary chart or number sits in a dominant position. Secondary information is placed in smaller or less central areas. But if you start moving elements around arbitrarily or resizing things without thinking about order, you break that structure.
The better approach: Stick to the intended layout of each template as a starting point. If you need to emphasize something differently, make small adjustments rather than overhauling the entire slide. Use size, color contrast, and position intentionally. The eye reads left to right, top to bottom, and large elements first. Keep your most critical information in those natural hotspots.
Mistake Four: Inconsistent Branding Across Slides
When you have 45 templates to choose from, it is tempting to use a different color scheme or icon style on every slide just because you can. Some people see the variety and think variety itself is the goal. But consistency is what builds trust and clarity in a presentation. If your slides jump from blue to orange to green without reason, the audience subconsciously senses disorganization.
The Corporate Business Infographics Bundle comes with a range of colors and graphics, but you are not supposed to use all of them in one deck. The strength of having 45 templates is that you can pick the right layout for each idea while keeping the look and feel unified.
The better approach: Before you start building your presentation, set your brand colors and stick to them. Choose three or four icon styles that match your industry and use them consistently. Use the same font across all slides. The templates are fully customizable, so you can apply your brand palette to every layout. This turns the bundle from a collection of random designs into a cohesive, professional deck.
Mistake Five: Choosing Style Over Substance
It is easy to fall in love with a template that looks flashy. A template with gradient backgrounds, bold shadows, and elaborate icons might catch your eye. But flashy is not the same as effective. If the design competes with your content for attention, you have already lost your audience.
The Corporate Business Infographics Bundle includes a variety of styles, from sleek and minimal to more elaborate. The most effective choice is not the one that looks most impressive in the thumbnail. It is the one that makes your data easiest to understand.
The better approach: Prioritize clarity over decoration. Choose templates with clean lines, simple backgrounds, and clear data visualization areas. Use the more ornate templates only when the content genuinely supports that treatment. For most business contexts—quarterly reviews, investor pitches, board updates—simple and professional outperforms flashy every time.
Mistake Six: Forgetting How People Actually View Presentations
Many people design slides on their large monitor at 100% zoom, then present them on a projector or share them on mobile devices. The difference in legibility is enormous. A chart with tiny labels that looked fine on your desktop becomes unreadable on a conference room screen. A slide with dense text paragraphs gets ignored when viewed on a phone.
The Corporate Business Infographics Bundle templates are designed with readability in mind, but that only helps if you maintain appropriate font sizes and data density when you customize them.
The better approach: Test your slides in the actual viewing environment before presenting. If you are projecting, stand six feet away from your monitor and see if you can still read everything. If you are sharing digitally, check how it looks on a phone screen. Use the templates' built-in hierarchy to keep text brief and numbers large. If a slide feels crowded, break it into two slides. The bundle gives you 45 templates—use them.
What to Check Before You Buy or Download
The Corporate Business Infographics Bundle is a versatile resource, but it pays to verify a few things before you commit to using it for an important project.
- File format compatibility. Make sure the templates work with the software you use—PowerPoint, Keynote, Google Slides, or whatever your team relies on. Most premium bundles offer multiple formats.
- Editable elements. Check whether you can change colors, fonts, icons, and data in charts without breaking the layout. The description says the bundle is fully customizable, but it is worth confirming that all elements are unlocked.
- Resolution and aspect ratio. If you are projecting in 16:9, make sure the templates match. If you need print-ready versions, check that the resolution is high enough.
- License terms. Understand whether you can use the templates for client work, commercial projects, or internal decks only. Most corporate bundles allow broad use, but reading the terms avoids headaches later.
How to Get the Most Out of the 45 Templates
The real value of the Corporate Business Infographics Bundle is not in any single template. It is in having the right layout for whatever business data you need to present. Some templates work best for timelines and roadmaps. Others are optimized for comparing numbers side by side. Still others shine when you need to show a process flow or organizational hierarchy.
Practical advice: Spend ten minutes browsing all 45 templates before you start your project. Note which ones map to the sections of your presentation. Then create a folder or document that links each template to a use case. This way, when you need to present quarterly results, you know exactly which three or four templates work best for that purpose. You build a personal library of go-to layouts.
The same principle applies when you are on a tight deadline. Having the bundle ready means you do not start from a blank slide. You start from a professionally designed foundation. You just add your specific data and adjust the messaging. That saves hours of formatting time and reduces the chances of creating something that looks amateurish.
Final Thoughts
The Corporate Business Infographics Bundle is a practical investment for anyone who regularly communicates business data. But like any tool, its value depends on how you use it. Avoid the common mistakes of overloading slides, ignoring hierarchy, mixing inconsistent styles, and prioritizing flash over clarity. Treat each template as a starting point for telling a clear story.
When you use the bundle with intention—selecting the right template for each message, keeping your branding consistent, and designing for your actual viewing environment—your presentations will stand out for the right reasons. Your audience will understand your data faster, remember your key points longer, and trust your message more. That is the outcome every business presenter is really after.